2008 - Age of Awakening / 2016 - Age of disclosures / 2021 - Age of Making Choices & Separation / Next Stage - Age of Reconnection and Transition! /
2024 - Two millenia-old Rational Collectivist societal cycle gives way to the Self-Empowered Individualism. /
2025 Golden Age begins
Showing posts with label milk. Show all posts

Wednesday, November 28, 2012

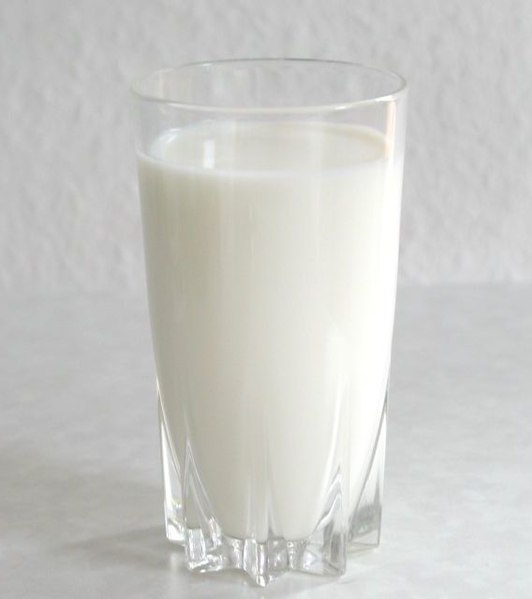
Milk and butter are good for you!

.
"India's poster boy for vegetarianism – he's just fathered a child at 96" (2012)

Quote:
He has been a strict vegetarian and has never drank alcohol. Instead, his diet is made up of fresh milk, clarified butter, vegetables and chapattis.

The Independent TUESDAY 27 NOVEMBER 2012

More details from another article (John, thanks!) :

"At 94, Indian Ramjit Raghav Is World’s Oldest Father" (2010)

My daily diet comprises three litres of milk, half a kilo of almonds and half a kilo of ghee [clarified butter].

Note: ~800g of pure fat or 7200kCal seems too much fat for 1 person. I suspect this amount must be for the entire family! For instance, my fat intake is only about 100-200g a day.

More longevity surprize (different man, Nanu Ram Jogi):

"World's oldest father has 21st child at 90" (2007)

Quote:

Mr Jogi, who attributes his remarkable virility to daily walks and plenty of meat, said: "I eat all kinds of meat - rabbits, lamb, chicken and wild animals."

.

Sunday, September 4, 2011

Milk and 40 Countries Study

.
An old paper: "Differences in Coronary Mortality Can Be Explained by Differences in Cholesterol and Saturated Fat Intakes in 40 Countries but Not in France and Finland"

The study found that "...with comparable intakes of dietary cholesterol in France and Finland, the CHD mortality rate for men aged 55 to 59 was four times higher in Finland than in France."

In science, finding an exception to a theory always serves as an opportunity to revaluate the theory. Except with the "Fat And Cholesterol Theory" (of heart disease). Since Fat And Cholesterol Theory is treated as fact, finding exceptions to the theory has been used instead to revaluate the exceptions rather than the theory.


One reason that I would consider table 3 having higher chance of reflecting some possible real effects, is that it shows the countries of the similar culture, level of development and standard of living, where as the statistical correlations shown in table 1 are done over vastly dissimilar populations whose different level of development produces totally different set of health hazards that may completely mask any food influence.  For example, most developed countries exhibit both high meat consumption and high CHD (but also higher longevity!). Similar statistics done within one country show typically completely different correlation, the most striking feature is typically a disapearance of correlation between Coronary Heart Disease (CHD) and fat, like for example in Malmo Study.

Correlations between Cholesterol and Saturated (fat) Index (CSI) or other consumption attributes and heart disease across Europe may or may not reflect causal connections. There may be many spurious factors possibly involved. However, if we assume, for the sake of discussion that the correlations in Table 3 may be reflecting some causal connections, then this presents us immediately with another "paradox" and not just about France but also involving other West European countries! Namely, that cholesterol and saturated fat cannot possibly explain the huge discrepancy of CHD stats between France, Germany (West), UK and Finland! One immediately notices that while CHD almost doubles from one country to the next in table 3, cholesterol and saturated fat consumption index is roughly the same! More specifically, the fact that butterfat remains also roughly the same (given typical low accuracy of the food statistics) - automatically invalidates the authors' conclusion published at the end (at least the part implicating "butterfat"). Comparison of other factors (except milk) between Germany and the UK also shows no clear trend, yet the CHD is vastly different!

Milk on the other hand, shows a clearly rising consumption trend in Table 3, that tracks the magnitude of the CHD! Not milk fat, not butter and not milk protein (cheese) - just milk! Why milk, what milk, is it real or spurious? If real, does it apply only to milk in Europe or in other parts of the world as well?
.

Friday, November 12, 2010

Cow's milk formula triggers t1 diabetes, new study

.

Dietary Intervention in Infancy and Later Signs of Beta-Cell Autoimmunity

A journalist's write-up is here

Double-blind study on 230 infants with HLA-conferred susceptibility to type 1 diabetes and with at least one family member with type 1 diabetes, were split into test group fed casein hydrolizate based formula, and the control group fed conventional cow's milk based formula.

Autoantibodies to insulin, glutamic acid decarboxylase (GAD), the insulinoma-associated 2 molecule (IA-2), and zinc transporter 8 were analyzed, as well as monitored for the incidence of diabetes t1, until the age of 10.  

The risk of developing diabetes t1 markers in the casein hydrolizate group was substantially reduced - by  ~50%, compared with the control group reciving cow's milk formula!

-------------------
Updated (14-Nov-2010)   This is going to be a story of two food villains and one food hero.


There is more to milk that 1 paper. Much more: a study involving a billion people. The China study. I am going to dump some facts here for the reference.

My source of data is Mono Mortality document. A cursory look at all diseases with the focus on correlation with milk reveals that milk correlates positively with almost all diseases! The same cursory look reveals also that two other food items: wheat flour and eggs correlate very consistently too across most diseases,
one positively one negatively. Note: positive correlation means that an increase in consumption is associated with more disease and more harm, whereas negative correlation means an increase in consumption is associated with less risk of a disease. The main bullet points of this review are these:

* Wheat flour correlates positively with almost all diseases (except pulmonary TB in adults)

* Milk correlates positively with almost all diseases (except diabetes)

* Eggs correlate negatively with almost all diseases (except cancer, diabetes and IHD)

One should keep in mind that a correlation is no causuation, however the fact that milk and wheat and eggs correlate simultaneously and follow the same consistent pattern, albeit with different signs, may indicate that something real is going on in the human biochemistry in relation to those foods. This is a strong indication that more reseaarch should be made to investigate the effect. This is also a indictment against Cornell University that sat on such a rich set of data for a decade without doing anything usefull about it. (Other than letting one of their staff profesor hijack the study title to propagate his veganism!)


--------------

Here are some examples, I will list correlation factors from the above linked document, for disease mortalities against wheat, milk and eggs only.  Correlation factors are given as two digit numbers in percentage, followed by the food item.

M015 Pullmonary TB (age 0-34):+34 Milk , -27 Eggs
M016 Pullmonary TB (age 35-69): -29 Wheat
M018 Other TB (age 35-69): +52 Wheat, -30 Eggs
M023 All cancer (age 35-69): +31 Eggs
M043 Endocrine (age 0-34): -36 Eggs
M044 Endocrine (age 35-69): -31 Milk
M045 Diabetes (age 35-69): -29 Milk, +26 Eggs
M050 Mental (age 0-34): +75% Milk
M059 All Vascular (age 35-69): +56 Wheat, +29 Milk, -26 Eggs
M060 Rheumatic (age 0-34): +37 Milk, -35 Eggs
M061 Rheumatic (age 35-69): +26 Wheat, -32 Eggs
M062 Hypertension (age 35-69): +43 Wheat, +75 Milk, -28 Eggs
M063 Ischaemic heart d.(age 35-69): +59 Wheat, +25 Eggs
M065 Stroke (age 35-69): +43 Wheat
M066 All vasc excl stroke (0-34): +33 Wheat, +42 Milk, -43 Eggs
M067 All vasc excl stroke (age 35-69):+65 Wheat, +50 Milk, -33 Eggs
M068 All respiratory (age 0-34): +50 Milk, -27 Eggs
M069 All respiratory (age 35-69): - (no correlation) -
M070 Pneumonia (age 0-34): +51 Milk, -27 Eggs
M071 Pneumonia (age 35-69): -32 Eggs
M087 Pregnancy and birth: +41 Wheat, +49 Milk, -48 Eggs
M104 Maternal mort.: +38 Wheat, +46 Milk, -42 Eggs

.